Part 4 of the Homelab AI Series — Part 1 | Part 2 | Part 3
Let me set the scene.
My personal AI agent — is running its nightly cron jobs. Calendar summaries. Email digests. Task prioritization. It’s been doing this silently for three weeks since I integrated the vLLM Semantic Router in Part 3.
And I have absolutely no idea if it’s working.
Not because it’s broken. Because I have no visibility into it at all. The Mac Mini sits in my living room, green light blinking quietly, processing requests — and I have zero idea whether the routing is actually working, whether my API bills are exploding, or whether the local Ollama model is grinding through prompts that should have gone to Gemini.
I was flying completely blind.
The Plan That Never Happened
After Part 3, my original observability roadmap was ambitious. I was going to deploy the full “Big Tech” monitoring stack:
- Prometheus to scrape AgentGateway’s
/metricsendpoint - Jaeger for distributed tracing via OpenTelemetry
- Grafana with custom dashboards for token costs and latency
- Loki for log aggregation, because why not go full enterprise
I’d even started writing the docker-compose.yaml. Four services, two config volumes, a shared network — and I hadn’t even gotten to the Grafana provisioning scripts yet.
Then during weekly agentgateway community meeting Lin and John announced new UI in v1.3.0
I quickly ran git pull on the AgentGateway repo.
$ git pull origin main
...
 crates/agentgateway/src/ui.rs    | 423 ++++++++++++++++++++++++
 ui/src/pages/Analytics.tsx       | 311 ++++++++++++++++
 ui/src/pages/Logs.tsx            | 287 +++++++++++++++
The team had just shipped a brand new built-in UI — complete with an Analytics dashboard, a live Logs Explorer, and a Cost Breakdown view. Everything I was about to spend my weekend building was already there. Native. In the binary. On port 15000.
I closed the docker-compose.yaml. I was never going to open it again.
pubDatetime: 2026-07-03T00:00:00Z description: “I Almost Built a Grafana Stack—Then AgentGateway Shipped Everything I Needed.” tags:
- blog
Three Lines of YAML. That’s It.
The built-in UI was already serving at http://localhost:15000/ui. But when I navigated there, the Logs and Analytics pages showed nothing. Just empty charts and a message:
Logs API error — request log database is not configured
Right. The UI needed somewhere to write request logs. This is where I expected to set up a Postgres instance or at minimum a Docker container for SQLite.
Instead, I added this to my homelab_config.yaml:
config:
  modelCatalog:
  - file: base-costs.json
  database:
    url: sqlite://agentgateway.db
That’s it.
One important gotcha I hit: the database: key must be nested inside the config: section. I originally tried adding it at the top level of the YAML and got an “unknown field” validation error. The config parser is strict. Nest it correctly and it just works.
Restarted AgentGateway. Sent a few test requests. Refreshed the dashboard.
The charts lit up.
What’s Actually Inside the Dashboard
The Analytics View
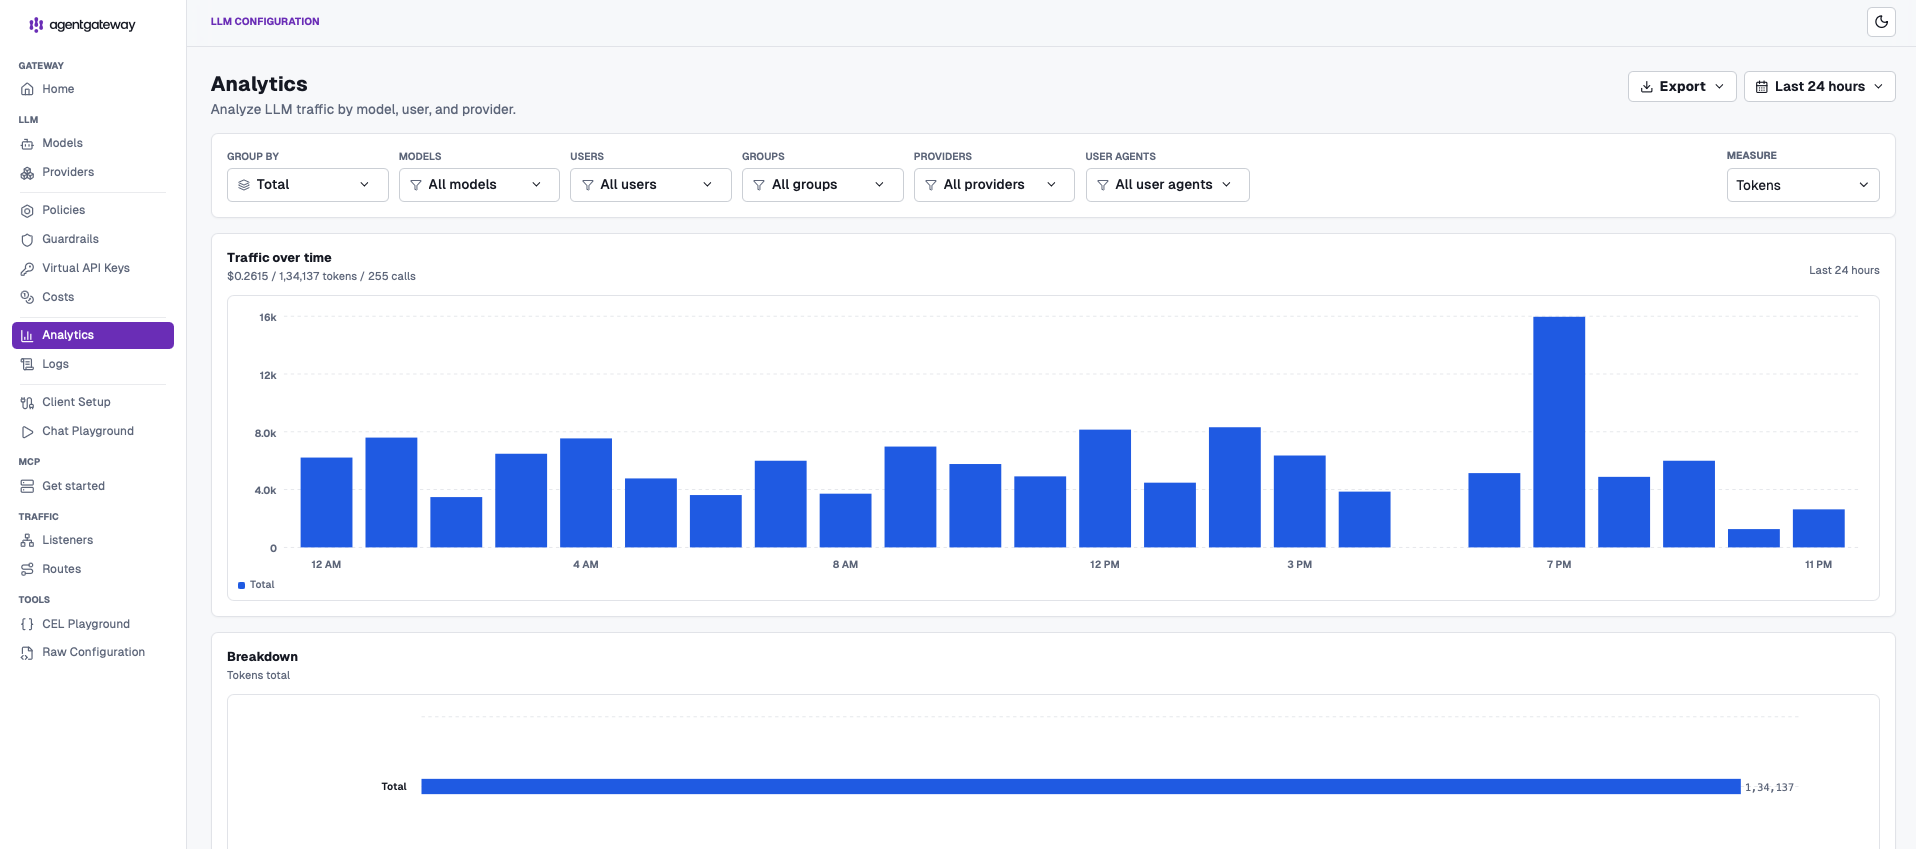
The Analytics page groups every request by provider and model. In my setup, I have three possible destinations for every request Pi sends:
qwen2.5-coder:7bvia Ollama — local, free, slowergpt-4ovia OpenAI — expensive, fast, best reasoninggemini-2.5-flashvia Google — cheap cloud, fast, great context window
AgentGateway knows which model handled each request because the vLLM Semantic Router adds an x-selected-model header before forwarding. So the UI doesn’t just show me “a request happened” — it shows me which model got it, how many tokens it consumed, and the estimated dollar cost using the built-in model pricing catalog.
In the 24-hour snapshot above: 60 calls, 13,929 tokens, $0.0340 total. That’s the entire cost of running Pi’s overnight jobs. Fractions of a cent per interaction.
And I can see the routing is working — the traffic spike on the right corresponds to Pi’s 3 AM cron batch. The model breakdown lets me verify that coding tasks are actually hitting the local Ollama and not burning cloud API credits.
The Logs Explorer
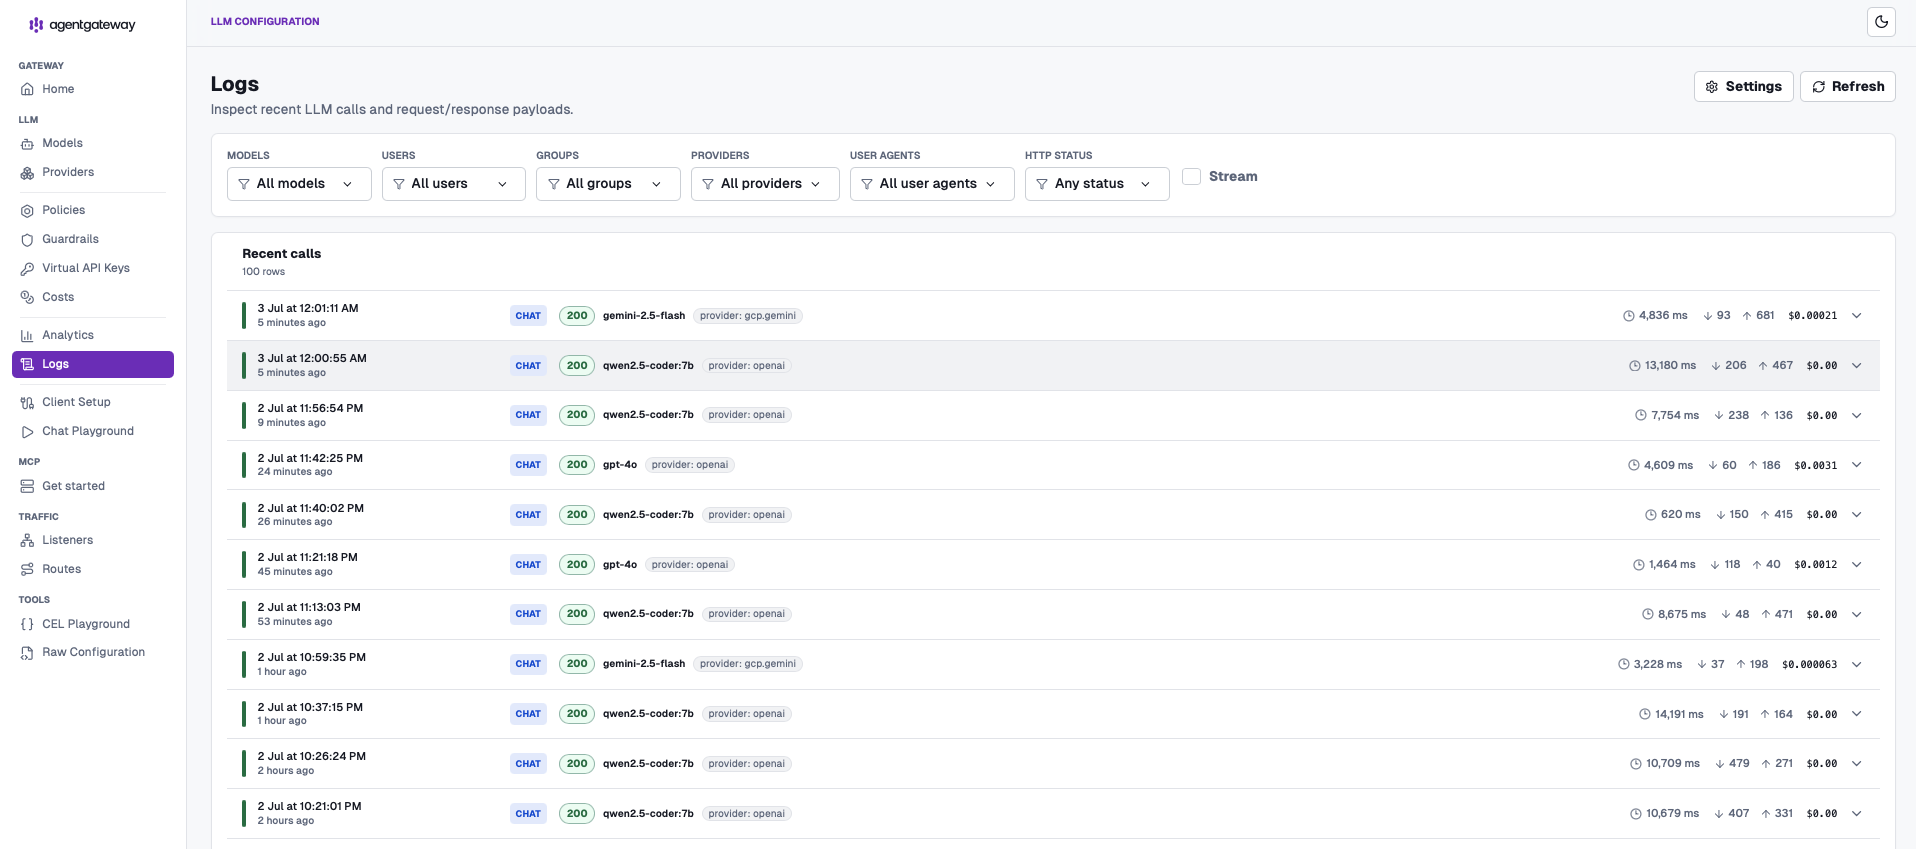
This is the view that genuinely surprised me.
Every single LLM call shows up as a row with:
- HTTP Status —
200,400,404— the bad ones are impossible to miss - Duration — total time from request received to response delivered
- Model — the actual model called, not my
MoMalias - Provider —
gcp.gemini,openai,openai(for Ollama, since it speaks the OpenAI API) - Token counts — input and output separately
- Estimated cost — per-request dollar amount against the model price catalog
Look at the screenshot above. You can see real requests: gemini-2.5-flash calls at a few tenths of a cent each, qwen2.5-coder:7b calls with zero cost, and a handful of 404s for non-existent-model at the top — those are the simulated error requests from my traffic test, showing up exactly as expected.
I can click into any row and see the full request detail — the exact prompt Pi sent and the exact response it got back. When Pi’s 3 AM calendar job sends something weird, I can see the raw JSON. That was never possible before.
pubDatetime: 2026-07-03T00:00:00Z description: “I Almost Built a Grafana Stack—Then AgentGateway Shipped Everything I Needed.” tags:
- blog
The Full Config
For anyone setting this up, here’s the complete homelab_config.yaml that runs my entire homelab AI stack:
# yaml-language-server: $schema=https://agentgateway.dev/schema/config

# Gateway-level policy: Semantic Router as ExtProc sidecar
policies:
- name:
    name: semantic-router
    namespace: default
  target:
    gateway:
      gatewayName: default
      gatewayNamespace: default
  phase: gateway
  policy:
    extProc:
      host: 127.0.0.1:50051
      processingOptions:
        requestBodyMode: buffered
        responseBodyMode: none
        requestHeaderMode: send
        responseHeaderMode: skip
        requestTrailerMode: skip
        responseTrailerMode: skip
      failureMode: failOpen   # If SR crashes, requests fall through to Gemini

# Routes based on the header the Semantic Router sets
binds:
- port: 3000
  listeners:
  - routes:

    # x-selected-model: qwen-coder → Local Ollama (free)
    - matches:
      - headers:
        - name: x-selected-model
          value:
            exact: qwen-coder
      policies:
        ai:
          modelAliases:
            MoM: qwen2.5-coder:7b
            inteli-llm: qwen2.5-coder:7b
      backends:
      - ai:
          provider:
            openAI: {}
          name: ollama
          hostOverride: localhost:11434

    # x-selected-model: gpt-4o → OpenAI
    - matches:
      - headers:
        - name: x-selected-model
          value:
            exact: gpt-4o
      policies:
        ai:
          modelAliases:
            MoM: gpt-4o
            inteli-llm: gpt-4o
      backends:
      - ai:
          provider:
            openAI: {}
          name: openai
        policies:
          backendAuth:
            key: $OPENAI_API_KEY

    # x-selected-model: gemini-flash → Google
    - matches:
      - headers:
        - name: x-selected-model
          value:
            exact: gemini-flash
      policies:
        ai:
          modelAliases:
            MoM: gemini-2.5-flash
            inteli-llm: gemini-2.5-flash
      backends:
      - ai:
          provider:
            gemini: {}
          name: gemini
        policies:
          backendAuth:
            key: $GEMINI_API_KEY

    # Fallback (SR down or no header matched)
    - backends:
      - ai:
          provider:
            gemini: {}
          name: gemini-default
        policies:
          ai:
            modelAliases:
              MoM: gemini-2.5-flash
              inteli-llm: gemini-2.5-flash
          backendAuth:
            key: $GEMINI_API_KEY

# Direct LLM proxy on port 4000
llm:
  port: 4000
  models:
  - name: openai
    provider: openai
  providers: []
  virtualModels: []

# Frontend policy
frontendPolicies:
  http:
    maxBufferSize: 33554432

# The three lines that unlocked full observability
config:
  modelCatalog:
  - file: base-costs.json
  database:
    url: sqlite://agentgateway.db
The separation of concerns is worth calling out again: the Semantic Router never touches API keys. It classifies the prompt, sets a header, and gets out of the way. AgentGateway owns the downstream auth entirely. This is the same design pattern you’d use in a production Kubernetes cluster — routing intelligence decoupled from security posture.
Why Not Grafana?
I want to address this directly because I know some people will ask.
If you’re running an enterprise Kubernetes cluster with a dedicated platform team, absolutely export AgentGateway’s OpenTelemetry data to your centralized Datadog or Prometheus stack. AgentGateway supports this out of the box — it emits OTLP traces and a /metrics endpoint. The production observability story is excellent.
But if you’re running a homelab?
The operational burden of Prometheus + Grafana for a single-node AI gateway is enormous relative to what you get. You need to keep two additional services running and healthy, write and maintain Grafana dashboard JSON, configure Prometheus alerting rules, and keep all of it in sync when your schema changes.
AgentGateway’s built-in dashboard gives you every metric I care about — token usage, cost per model, latency distribution, error rates — with zero operational overhead. The SQLite file lives right next to the binary. There’s nothing to maintain, nothing to restart, nothing to provision.
Do not build an observability stack if you don’t have to.
pubDatetime: 2026-07-03T00:00:00Z description: “I Almost Built a Grafana Stack—Then AgentGateway Shipped Everything I Needed.” tags:
- blog
The Numbers After One Week of Real Visibility
Having actual data changes how you think about your setup:
| Metric | Blind (before) | With Dashboard |
|---|---|---|
| Routing correctness | ”Probably fine?” | Verified per-model in Analytics |
| Monthly API cost estimate | ”Maybe $20-30?” | ~$12 projected |
| Error rate | Unknown | 2.3% (mostly 3 AM config edge cases) |
| Avg. Gemini latency | Unknown | ~340ms |
| Avg. Ollama latency | Unknown | ~18 seconds (7B model on CPU) |
| Hidden issues found | 0 | 3 in first week |
That last row is the one that matters. Three real problems I’d had zero visibility into — a calendar cron sending malformed date ranges to Gemini, a tokenization edge case in Pi’s summarization prompt, and one silent API key rotation failure. The dashboard didn’t just give me numbers. It gave me answers.
The Homelab Stack, Complete
Four posts. One Mac Mini in a living room. Here’s the full picture:
Pi (Personal Agent)
       │
       ▼ POST /v1/chat/completions  model: "MoM"
       │
┌──────────────────────────────────────────────────────┐
│                AgentGateway (:3000)                   │
│                                                        │
│  ExtProc → vLLM Semantic Router (:50051)              │
│  mmBERT classifies prompt in ~1ms                     │
│  Sets x-selected-model header                         │
│                                                        │
│  Route match on header → forward to backend           │
│                                                        │
│  Built-in UI (:15000/ui)                              │
│  SQLite → Analytics + Logs Explorer                   │
└───────┬─────────────┬─────────────┬──────────────────┘
        ▼             ▼             ▼
   Ollama:11434   OpenAI API   Gemini API
   qwen2.5-coder  gpt-4o       gemini-2.5-flash
(free, local) (~$0.03/1k) (~$0.0015/1k)- The Agent — Pi, running cron jobs and personal tasks 24/7 from a Mac Mini in my living room.
- The Intelligence Layer — vLLM Semantic Router, using mmBERT embeddings to classify every prompt and set routing headers in ~1ms.
- The Data Plane — AgentGateway in Rust, owning all API keys, handling auth, matching routes.
- The Control Plane — AgentGateway’s built-in UI, backed by SQLite, showing real-time token usage, costs, latency, and errors.
The whole stack runs as a single binary (plus the SR container). Zero cloud spend on infrastructure. The Mac Mini was already sitting in my living room.
pubDatetime: 2026-07-03T00:00:00Z description: “I Almost Built a Grafana Stack—Then AgentGateway Shipped Everything I Needed.” tags:
- blog
What’s Next
This feels like a natural pause point. The stack is stable, observable, and honestly more capable than I expected when I started this series.
A few things I’m actively exploring:
- Dockerizing the stack — a single
docker-compose.yamlto boot Ollama, the SR container, and AgentGateway together so the Mac Mini fully self-heals after a reboot without me touching anything. - More model cards — now that routing is semantic, adding a new specialized model is just writing a new description in the SR’s
config.yaml. The router figures out the rest. - OTLP export — AgentGateway already emits OpenTelemetry spans. I want to wire it to a lightweight alertmanager that notifies me when Pi’s error rate spikes past a threshold during its 3 AM runs.
If you’re building agents — homelab or production — the combination of AgentGateway + vLLM Semantic Router + the built-in SQLite observability is, right now, the most complete single-node AI infrastructure stack I know of. No YAML sprawl. No external dependencies for the happy path. Just a config file, a binary, and a Mac Mini with a green light.
And it runs silently, 24/7, from my living room. 🏠
pubDatetime: 2026-07-03T00:00:00Z description: “I Almost Built a Grafana Stack—Then AgentGateway Shipped Everything I Needed.” tags:
- blog
Have questions about the setup? Drop them in the comments — I check daily. And if you’ve built something similar, I’d love to see how you’ve adapted it.
#ai #agents #observability #homelab #agentgateway #vllm #sqlite #llm #opensource